November 26, 2025
Learn how to identify the apples-to-apples pay gap comparison using regression analysis.
Category:
PayGap GuideAuthor:
Alexander Gram
/
CEO & Co-Founder
Under the EU Pay Transparency Directive, employers will soon be required to identify and explain any significant gender pay gaps. Specifically, gaps above 5% within groups of employees performing work of equal value. This means HR and compensation professionals must go beyond reporting a single number and actually investigate why pay gaps exist.
Simply looking at the unadjusted pay gap (the average difference in salaries between men and women) doesn't tell the whole story. To ensure we compare apples for apples, we use regression analysis. In this article, we'll break down how regression analysis is used in pay equity audits, and how to interpret its results.
Let's get started!
The unadjusted gender pay gap is typically the first (and easiest) KPI calculated in a Pay Equity audit. It could say that "on average Women earn 12% less than Men". It's useful as a high-level indicator, but it pools everyone together regardless of job level, experience, or role.
This raw gap "doesn't tell you why" a difference exists. Perhaps more men occupy higher-paying senior positions. Such a factor can heavily influence the average pay difference. So, a double-digit unadjusted gap can mix together legitimate pay factors and structural issues in representation.
To illustrate, consider a hypothetical company "Company X." Suppose the average male employee earns €60,000 and the average female earns €54,000. That's a 10% unadjusted pay gap in favor of men. However, this number alone is misleading: it doesn't account for who is doing what jobs. Maybe ACME X has more men in higher-paying technical roles and more women in junior or support roles. The unadjusted gap often reflects these representation differences, not necessarily instances of unequal pay for work of equal value. In other words, a sizable raw gap can signal that women are concentrated in lower-paying positions (a diversity and opportunity issue), even if within each role men and women might be paid equally.
Most importantly, regulators understand this nuance. The EU directive will require reporting by category of workers (employees doing work of equal value). The unadjusted gap is just the straight average difference between male and female pay. The adjusted gap, on the other hand, measures the pay difference after accounting for factors that determine pay (like seniority, education, experience). Think of the adjusted gap as focusing on equal pay for equal work. At the essence, we would like to ask the following: "For men and women in the same situation, is there a pay difference?" This is the gap we need regression analysis to uncover.
Regression analysis is the foundational statistical method that enables an apples-to-apples comparison between employees. In a pay equity audit, we essentially build a model that predicts an employee's pay based on legitimate factors such as their job level, tenure, performance rating, etc., and checks whether gender still has an effect on salary after controlling for those factors. In simple terms, regression asks: if we take two comparable employees; same role, same qualifications and experience - does one gender consistently earn less than the other? If yes, that suggests a pay equity problem.
Another way to look at it: descriptive statistics (or average salaries) might show a gap, but regression analysis helps figure out whether that gap is due to discrimination or explained by valid factors. When doing the regression analysis, we drill down in the data and filter out all the noise that might influence the differences in pay, and are not related to the gender. For example, imagine our ACME X company runs a regression and finds that after accounting for job level, education, tenure, and experience, the gap shrinks from 10% to an adjusted 4%. That adjusted gap indicates that, on average, a woman at ACME X earns about 4% less than a man in the same role with similar qualifications. In practical terms, that means a female employee could be missing out on €4 for every €100 a comparable male colleague earns. Such a gap likely points to unfair pay practices, since all the legitimate and objective pay factors have been equalized.
Regression is considered the "golden standard" as it allows us to isolate gender's impact on pay. By inputting all the job-related predictors of salary into the model, we can see what the "expected" pay is for each person if gender played no role, and then measure any leftover difference associated with gender. This transforms the analysis from a simple comparison of group averages into a refined comparison of individuals on a level playing field. It's the technique that enables us to say with confidence, "After controlling for legitimate factors, women/men in this organization earn X% less than equivalent men/women."
And importantly for compliance, this adjusted gap is exactly what helps employers meet the directive's mandate to explain differences. Calculating an adjusted gap for each category of worker is a "very efficient way" to determine if any >=5% gap remains after accounting for objective reasons. If an adjusted gap above 5% persists, that's a red flag, as it suggests there's an unexplained disparity that needs to be addressed (or formally justified if somehow defensible).
A foundational step in any regression-based pay audit is selecting the pay factors to include in the model. We want to use factors that legitimately explain pay differences, and they must be objective, gender-neutral criteria that reflect the work being done. Common examples include: job level or grade, tenure with the company, years of experience, location or regional market, education or certifications, time in job, and performance ratings. These are factors that any reasonable employer might use to differentiate pay. For instance, a senior software engineer is expected to earn more than a junior engineer; someone with 10 years at the company might earn more than a new hire (be careful with certain employee groups though). If men and women differ on these dimensions (and often they do, e.g. men may have longer tenure on average or work more in higher-paying departments), incorporating these variables helps ensure we compare apple for apple.
However, you need to be cautious when using pay factors: we must ensure the factors themselves are not tainted by gender bias. This is where some well-intentioned analyses can go wrong. For example, performance is a legitimate pay factor as higher performers should earn more. But what if your performance ratings contain bias (conscious or unconscious) against women? Then including the raw performance score in the regression could "bake in" that bias, effectively rationalizing a gender pay gap as merit-based when it's not. In other words, is lower compensation due to genuinely weaker performance, or is a lower performance evaluation itself a result of bias?
Pitfall to avoid: Over-controlling for variables that essentially double-count or hide discrimination. For instance, imagine including an employee's current job level in the regression. But suppose women in your firm tend to be in lower levels due to a glass ceiling. Your regression might find no gender pay gap within each level, yet women are still paid less overall because they're stuck at lower levels. That scenario would show up as a zero adjusted gap but a notable unadjusted gap, indicating a representation problem rather than direct pay discrimination. This is why analysts often say you should examine both adjusted and unadjusted gaps: the adjusted gap tells you about equal pay for work of equal value, while the unadjusted gap tells you about equal opportunities (or lack thereof) for reaching higher-paying roles. Both are important, and the EU framework in fact requires looking at pay differences by category of work and overall averages for a holistic picture.
To select the right factors, a best practice is to start with your compensation philosophy and policies. What factors does your company use to set pay? If pay is linked to performance ratings and tenure, those belong in the model, given that you trust those metrics. If education or certifications are required for certain roles and affect pay, include them. It's common to "test a range of factors" and see which ones actually have a significant relationship with pay, keeping those that are job-relevant and aligned with company pay policy.
When finalizing the model, it is very important that you only include factors that are defensible as a gender-neutral explanation for pay differences. And remember, data quality matters. You must ensure your HR data on these fields (e.g. tenure, job level, etc.) is accurate and up to date before feeding it into analysis.
Once you have your data and variables ready, how do you set up and run the regression? Here are some best practices, explained simply:
1. Use a Log-Linear Model for Salaries
It's common to apply a logarithmic transformation to the salary variable in regression (i.e. model log(salary) instead of salary itself). Don't let the term scare you, this just means the regression will effectively look at percentage differences instead of raw currency amounts. Why do this? Because a €5,000 gap is far more significant on a €30,000 salary than on a €300,000 salary. A log-linear model evens this out and lets the results be interpreted in percentage terms. This both stabilizes variance and reflects that pay grows multiplicatively (e.g., compounding with tenure/level).
For example, if the regression on log-pay finds that an additional year of tenure has a coefficient of 0.01, that implies roughly a 1% pay increase per year of tenure. A gender coefficient of -0.04 would mean women earn about 4% less than comparable men (a negative because the variable might be coded as female=1). This approach is considered standard. In fact, most academic studies use log-salary models. It makes communicating the findings a lot easier, since we can talk in terms of "percent pay gap" directly.
2. Ensure Sufficient Sample Size and Robust Groupings
Regression works best with a decent amount of data. If you only have a handful of employees in a certain category, the statistical results won't be reliable. A rule of thumb is to be cautious with very small groups (say, fewer than ~30 observations). The model might not detect a gap even if one exists, simply due to noise. Within each category, make sure there are enough people of each gender to draw conclusions. If not, you might use alternative methods like median/mean comparisons, and deal with differences on a case-by-case basis.
3. Consider a Blinder-Oaxaca Decomposition
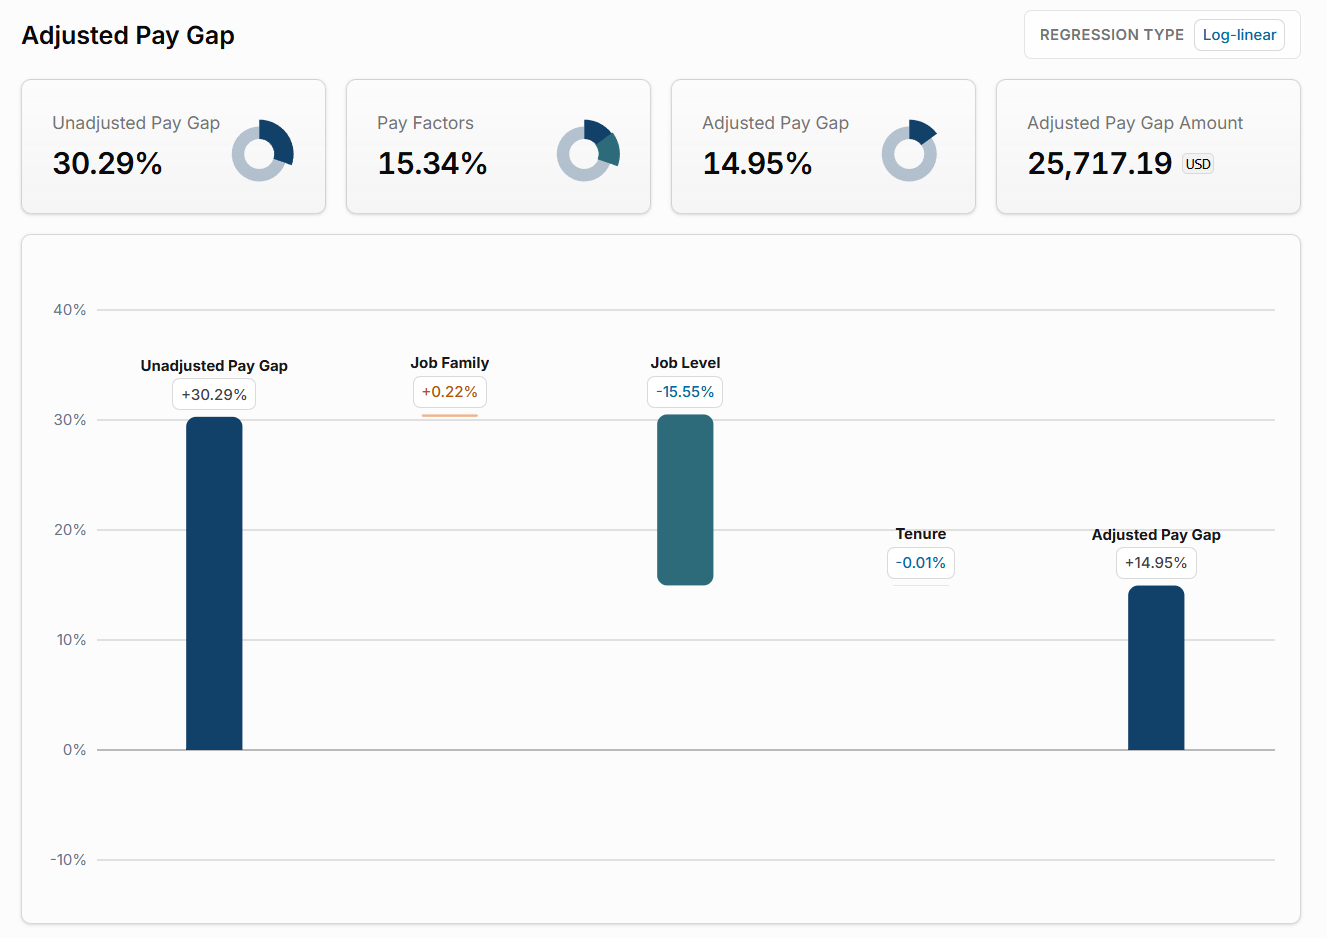
This is an analytical add-on that can provide very insightful results from your regression. The Oaxaca-Blinder decomposition takes the output of a regression and breaks down the overall pay gap into two pieces: "explained" vs. "unexplained." In essence, it quantifies how much of the gender pay gap is due to differences in characteristics (like one group having more experience or higher positions) and how much remains unexplained after accounting for those factors. For example, suppose your company's overall gender pay gap is 10%. A decomposition might reveal that 8% out of that 10% is explained by legitimate factors (perhaps men on average have higher tenure or work in higher-paying job families - such as IT) and the remaining 2% is unexplained. That unexplained portion is essentially the adjusted gap, which is the part of the gap that regression says cannot be accounted for by the objective pay factors, and thus could indicate discrimination or inequities in pay practices. (Important caveat: it could also include the effect of any relevant factors you didn't include in the model, so it's not proof of bias, but it's a strong indicator.)
Presenting results this way is very practical. Stakeholders can see, for instance, that "Yes, we have a 10% raw gap, but 8 percentage points of that are due to men and women holding different jobs/levels. The remaining 2% gap is within similar roles and is unexplained." This not only highlights the magnitude of potential pay inequity to address, but also emphasizes longer-term talent management issues (like representation in higher roles) that drive the explained portion. Many HR professionals find this helps focus the conversation: fix the unexplained gap immediately (that's pay equity), and work on the career progression pipeline to reduce the explained gap (that's equal opportunities).
4. Maintain Statistical Rigor (but Keep it Understandable)
Regression analysis produces a lot of statistical output, such as coefficients, p-values, R-squared, etc. You don't need to be a statistician to use it, but you should apply standard decision rules. One key concept is statistical significance. Essentially, a regression will tell you not just how large a gender gap is (the coefficient size), but also how confident we are that the gap is real and not just due to random chance. This is where p-values come in. Typically, we use a threshold like p < 0.05 to determine if a result is significant.
For example, if the gender pay gap coefficient is -0.025 (meaning women earn ~2.5% less) and the p-value is 0.02, that result is statistically significant - we can be quite confident the gap is real and would likely recur in the population. On the other hand, if we found a -0.005 gap (women 0.5% behind) with p = 0.15, we'd say that gap is not statistically significant. This means it might just be noise, and we can't conclusively say women earn less in that scenario. Best practice is to report both the adjusted gap size and whether it's significant. In our example, we'd communicate something like: "After controlling for level, tenure, etc., women earn about 2.5% less than men, and this difference is statistically significant." That signals to leadership that the gap is unlikely to be random and likely requires action.
Another best practice is to involve experts or use validated tools. Regression is powerful but can be complex. Many companies use specialized pay equity software or consult with statisticians to ensure the analysis is done correctly - especially for compliance projects. However, understanding the core concepts as an HR or reward professional is still important under the new Pay Transparency regime - it will help you ask the right questions and interpret the results in the right context.
Interpreting a pay equity regression means piecing together a narrative from the numbers. Here's how to approach it:
Adjusted Pay Gap
This is the headline result, and usually expressed as a percentage difference between comparable men and women. If your analysis finds, say, an adjusted gap of 3% (women paid 3% less than men after controlling for all factors), that's your measure of unequal pay for equal work. Ideally this number is zero, or very close to it. A small gap might fall within a "tolerance" range (for instance, some organizations consider gaps under 2% as effectively zero, given data limitations). But under the EU directive, any gap above 5% within a category that cannot be justified by objective factors will trigger a joint pay assessment, if it has not been fixed within 6 months. So, pay special attention to any adjusted gap exceeding that threshold, as you will need to either explain it with a legitimate reason or remedy it.
Statistical Significance
As noted, check the p-value or confidence interval for the gender coefficient. A statistically significant gap means it's a robust finding, for example, "women earn 5% less than men in similar roles, and this result is significant at the 5% level." A non-significant gap suggests that with the given data, you can't rule out the possibility of no real difference. However, lack of significance isn't always "case closed." If the sample size is small or the data noisy, you might have an inconclusive result. Generally, a significant gap should prompt action, whereas an insignificant gap might be noted for watching or be dealt with using visual statistics. Courts and regulators tend to expect that any statistically significant unexplained gap is addressed. It is hard to justify away a pay gap which an analysis shows is very unlikely to be due to chance.
Contribution of Factors
Look at which factors in the regression were significant predictors of pay. This can be illuminating beyond gender. For instance, you might find that tenure has a strong positive effect on pay (meaning your pay structure rewards long service, which is particularly relevant for blue collar groups), or that a certain department or job family has higher pay even after controlling for level. These insights can spark useful HR questions, such as, Is our pay policy intentionally emphasizing tenure, or is that a sign of outdated salary progression? In terms of pay equity, checking the factors also ensures they make sense. If something like education isn't significant, perhaps it shouldn't be a big part of pay decisions. If performance is significant (and you're confident in your performance ratings), that's good, as it shows high performers are rewarded, and it might also reassure you that gender gap isn't due to performance differences. If performance isn't significant in the model, that could imply a need to review how merit-based your pay really is.
Outliers and Individual Cases
Regression can also identify individual employees who deviate a lot from the predicted pay (sometimes called outliers or residual analysis). Often, these outliers warrant a closer look, as they could be cases where an individual's pay is off for a legitimate reason not captured in the data (perhaps they have a unique skill or role), or they might be unintended inequities (e.g., someone underpaid relative to peers). Part of interpreting results is therefore to flag such cases and decide if any adjustments are needed at the individual level to ensure consistency and fairness.
Documenting Legitimate Explanations
If your analysis finds an adjusted gap, you'll need to explain what's driving it. Sometimes the regression itself provides the answer (e.g., "We see women have lower pay after controlling for everything; no legitimate factor explains it, so the gap is likely due to bias or negotiation differences, therefore we must fix it."). In other cases, you might find a gap within a certain subpopulation and then investigate further. For compliance, it's important to document any "objective justification" for pay differences. For example, if men on average earn more in a certain job family because they have, say, more overtime hours or a specific technical certification, note that. The EU directive allows differences that are due to legitimate factors like performance, experience, etc.; what it doesn't allow is an unexplained gap that consistently disfavors one gender.
Finally, the goal of all this analysis is action. If you find gaps, the next step is remediation: adjusting salaries, revisiting pay policies, or strengthening bias mitigation in processes. Many leading organizations strive for not just compliance (staying under that 5% unexplained gap trigger), but real equal pay - a 0% adjusted gap. The good news is that doing these analyses regularly will put you in a great position to achieve that. It creates an internal benchmark for equal pay, helps pinpoint trouble spots, and lets you track progress. Moreover, it sends a message to employees that you're committed to fair pay, which can boost trust and engagement.
Regression analysis might sound technical, but as we've seen, its role in pay equity audits is fundamental. It's about ensuring we compare apples to apples, so that we can transparently and fairly assess whether men and women are paid equally for work of equal value. In the context of the EU Pay Transparency Directive, mastering this approach will be essential for HR and reward professionals. It provides the rigor and evidence needed to explain or eliminate gender pay gaps in line with the "equal pay for work of equal value" principle. By selecting the right factors, using robust methods like log-linear models and decomposition, and interpreting the results with a critical eye, you can analyze your HR data to assess how your pay policies are implemented in practice.
This process isn't only about compliance or avoiding fines; it's a chance to emphasize that as an employer you take fair pay seriously.